The easiest way to run
ClickHouse at any scale

Propel is a Serverless ClickHouse platform with APIs and
Embeddable UIs for developers to ship data apps in record time.

Serverless ClickHouse

Serve blazing-fast queries with the world's fastest real-time analytics database.

  • Sub-second query latencies over billions of rows.
  • Serverless auto-scaling for high-concurrency.
  • Mission-critical reliability.
  • Secure GraphQL and SQL APIs.
Learn more
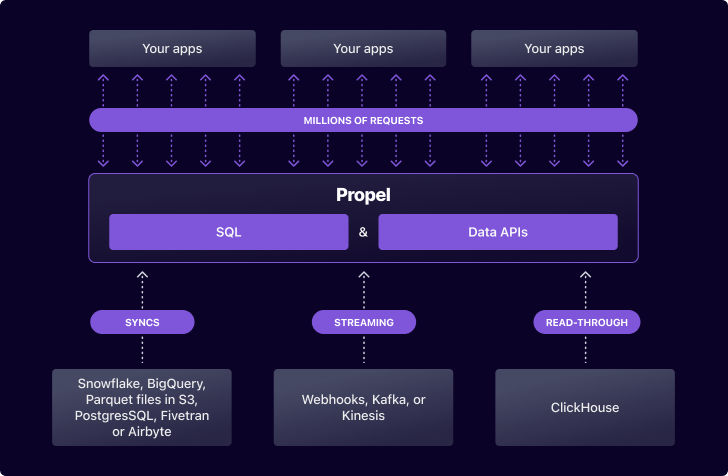
ingestion diagram

Built-in ingestion pipelines

Bring your data together, unifying your warehouse and streaming data.

  • Ingest real-time streaming data.
  • Sync from your data warehouse.
  • Sync from your database.
  • Complete pipeline observability.
  • Works with Fivetran and Airbyte.
Read the docs

Data APIs

Build faster with APIs for every data feature.

  • Counter
  • Data Grid
  • Leaderboard
  • Metric Report
  • Records by ID
  • Time Series
  • Top Values
  • SQL API
Read the docs

Control Access

Securely build analytics into multi-tenant apps.

  • Scoped API credentials
  • Column- and row-level Access Policies.
  • Multi-tenant access controls.
Read the docs

Semantic layer

Define metrics once and query them anywhere.

  • SUM, AVG, MIN, MAX, COUNT, and COUNT_DISTINCT Metrics.
  • Custom Metrics.
  • Metric Query API.
  • Metric Management API.
  • Terraform Metric definitions.
Read the docs
react components

Embeddable UI Components

A complete UI toolkit fully integrated with the API.

  • <TimeSeries>, <PieChart> & <Leaderboard> components.
  • Time and date range picker components.
  • Simple and advanced filter components.
  • Access token request and refresh management.
  • Integrated data fetching.
  • Loading and error states.
Read the docs
Trusted by
calliper logo
tackle.io logo
Backed by
Use cases

One platform, all your use cases

Power internal and customer-facing use cases with a single data platform.
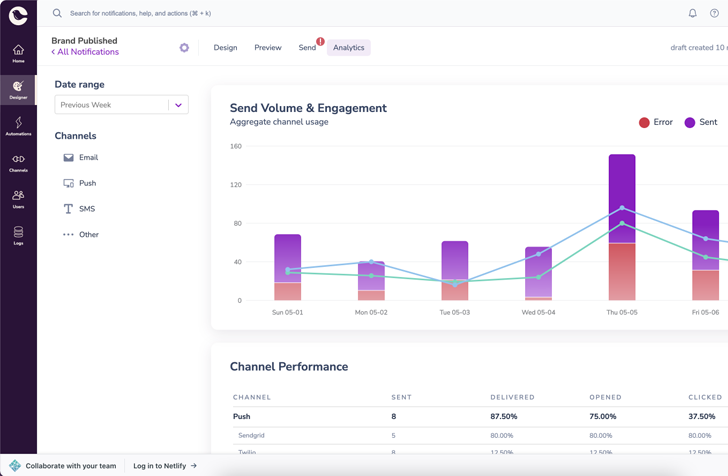
Embedded analytics

Deliver in-product analytics experiences that look and feel native to your product.

“We delivered our enterprise embedded analytics in two sprints with Propel.” - Courier

Data APIs

Deploy instant low-latency data APIs in minutes over Kafka, JSON Events, ClickHouse, Snowflake, Parquet files in S3, or PostgreSQL.

“Data APIs gave us the flexibility to power many use cases, from personalization APIs to product usage emails, with the same platform.” - Top Travel Company

SaaS dashboards

Launch the analytics your customers have been asking for in days, not months.

““With Propel, we met a 30-day deadline to launch analytics in our product 💪🏽” - Tango

IoT and operational insights

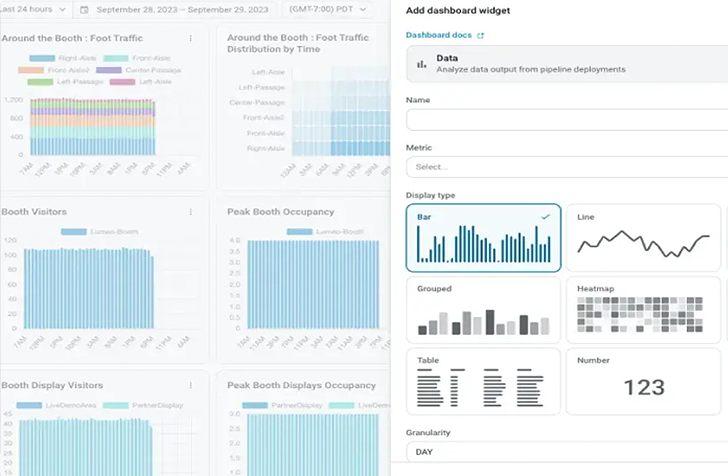
Deliver flexible, fast, real-time customizable dashboards to deliver the operational insights your users need.

“Data shows up in seconds and dashboards load super fast.” - Lumeo

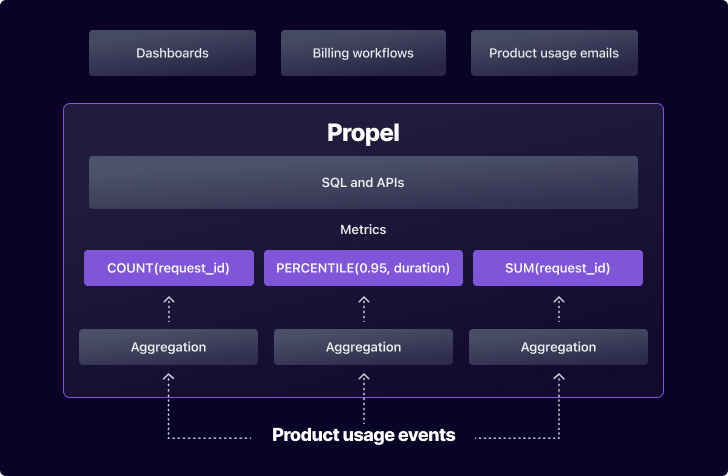
Product usage metering

Define metrics and measure, report, and alert on product usage.

“Our operational metrics are huge differentiator as it enables our customers to scale with confidence.” - Top API Company

ChatGPT usage analytics

Track, meter, report, bill, and enforce limits on ChatGPT usage metrics.

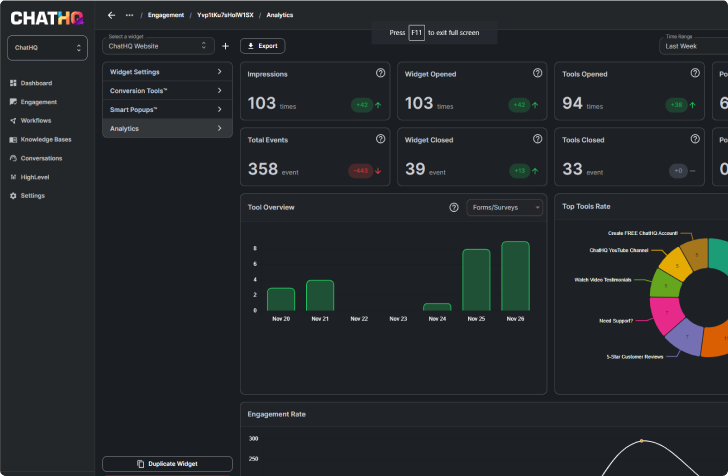
“Our own UI without having to worry about the analytics backend, fuck yeah. This is it.” - ChatHQ

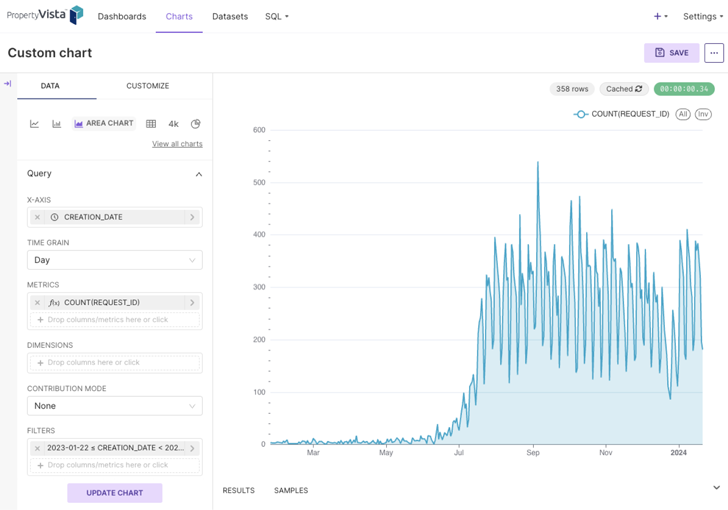
Self-service custom reporting

Deliver custom reports to your highest-value customers without engineering or manual work.

“Customers that create their own reports see more value in our product.” - Property Vista

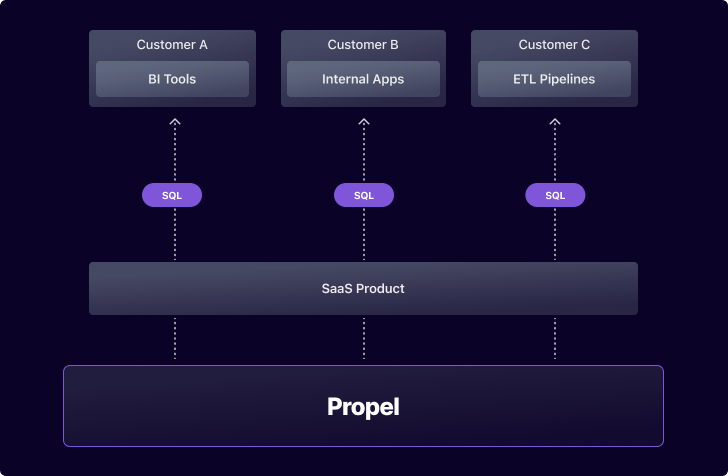
Data sharing

Give your customers their data via a SQL interface compatible with any BI tool.

“The SQL interface has unlocked an insane amount of customer value. We are now offering it as a premium feature.” - Top SaaS Company

Property Vista Dashboard
Courier’s enterprise analytics dashboard powered by Propel. Courier Customer Story
data apis diagram
tango graphic
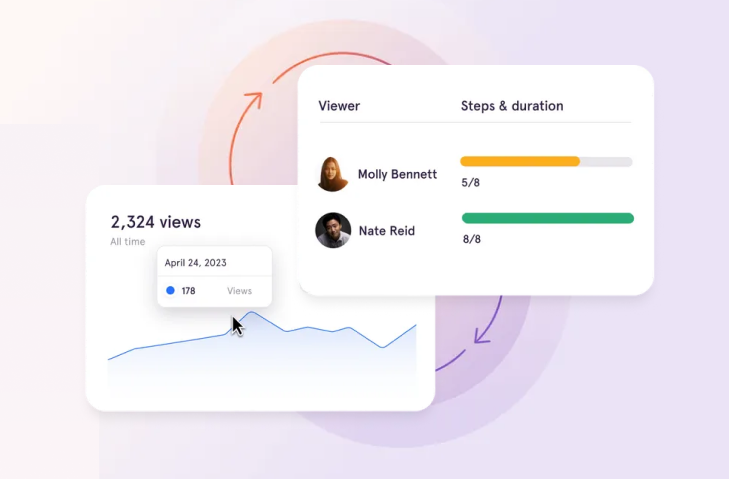
Tango’s workflow analytics powered by Propel.
Lumeo's dashboard
Lumeo’s real-time analytics dashboard powered by Propel.
metering diagram
ChatHQ dashboard
ChatHQ’s dashboard powered by data from their MongoDB ingested into Propel.
property vista dashbaord
data sharing diagram
Development workflow

How Propel Works

The complete toolkit to ship the best analytics products on the planet.

Ingest

Get fresh data from anywhere

Unify and bring your batch and streaming together. It is as simple as connecting your data source or sending JSON events.

Data sourcesPropel's data sources
Transform

Unify, transform, aggregate, and enrich in real time

Use Propel's powerful Materialized Views tools to clean, join, format, aggregate, and enrich your data, preparing it for analysis in real time.

Propel real-time transformations
Model

Model data into metrics

Define metrics from your data that represent key performance indicators for your product. These metrics can create insightful dashboards and reports for your customers.

Propel Metric definitions
Develop

Query using the SQL that you already know

Query using SQL through the API, React Query Hooks, or a PostgreSQL-compatible SQL connector. Our multi-tenant access policies ensure that end customers can only query their own data.

Integrate with any framework or programming language

SELECT 
    restaurant_id,
    restaurant_name,
    taco_name,
    SUM(quantity) AS total_tacos_sold,
    SUM(taco_total_price) AS total_sales,
    AVG(taco_unit_price) AS average_taco_price
FROM 
    "TacoSoft Demo Data"
WHERE 
    order_item_generated_at >= NOW() - INTERVAL '1 month'
GROUP BY 
    restaurant_id, 
    restaurant_name, 
    taco_name
ORDER BY 
    total_sales DESC;
query {
  sqlV1(input: { query: """
    SELECT 
      restaurant_name,
      taco_name,
      SUM(quantity) AS total_tacos_sold,
      SUM(taco_total_price) AS total_sales,
      AVG(taco_unit_price) AS average_taco_price
    FROM 
      "TacoSoft Demo Data"
    WHERE 
      order_item_generated_at >= NOW() - INTERVAL '1 month'
    GROUP BY 
      restaurant_name, 
      taco_name
    ORDER BY 
      total_sales DESC
    LIMIT 10
  """ }) {
    columns { columnName }
    rows
  }
}
  curl -X POST https://api.us-east-2.propeldata.com/graphql \
  -H "Content-Type: application/json" \
  -H "Authorization: Bearer <Access Token>"; \
  -d '{
    "query": "query sql($input: SqlV1Input!) { sqlV1(input: $input) { columns { columnName } rows } }",
    "variables": {
      "input": {
        "query": "SELECT * FROM \"TacoSoft Demo Data\" LIMIT 3"
      }
    }
  }'
import { useSql, useAccessToken } from '@propeldata/ui-kit'

function Sql() {
  const { accessToken } = useAccessToken()
  const { data } = useSql({
    accessToken,
    query: 'SELECT * FROM "TacoSoft Demo Data" LIMIT 5'
  })
  const { columns, rows } = data?.sqlV1 ?? {}

  return (
    
        {columns?.map((col, i) => (
          
        ))}
      
      {rows?.map((row, i) => (
        
          {row?.map((col, j) => (
            
          ))}
        
      ))}
    
{col?.columnName}
{col}
) }
$ psql -h postgresql.us-east-2.propeldata.com \
       propel $PROPEL_APPLICATION_ID

propel=> SELECT restaurant_name, 
                taco_name, 
                SUM(quantity) AS total_tacos_sold, 
                SUM(taco_total_price) AS total_sales, 
                AVG(taco_unit_price) AS average_taco_price
         FROM "TacoSoft Demo Data"
         WHERE created_at >= NOW() - INTERVAL '1 month'
         GROUP BY restaurant_name, taco_name
         ORDER BY total_sales DESC
         LIMIT 3;
Read the docs
Develop

Build apps with ultra-fast Data APIs

Build data apps without backend dependencies with highly optimized data APIs for common access patterns.

# Revenue this month vs last month
query {
  revenueThisMonth: counter(input: {
    metric: { name: "Revenue" },
    timeRange: { relative: THIS_MONTH },
		filters: [],
  }) {
    value
  }
  revenuePreviousMonth: counter(input: {
    metric: { name: "Revenue"},
    timeRange: { relative: PREVIOUS_MONTH }
		filters: [],
  }) {
    value
  }
}
Read the docs
query {
  dataGrid(input: {
		dataPool: { "name": "TacoSoft Demo Data" },
    timeRange: { relative: THIS_MONTH },
    columns: ["timestamp", "order_item_id", 
              "taco_name", "taco_total_price"],
    orderByColumn: 1,
    sort: DESC,
    filters: [],
    first: 5
  }) {
    headers
    rows
    pageInfo {
      hasNextPage
      hasPreviousPage
      endCursor
      startCursor
    }
  }
}
Read the docs
# Top restaurants by revenue this month
query {
  leaderboard(input: {
    metric: { name: "Revenue"},
    sort: DESC,
    timeRange: { relative: THIS_MONTH },
    rowLimit: 10,
    dimensions: [{ columnName: "restaurant_name" }]
  }) {
    headers
    rows
  }
}
Read the docs
# Restaurant by taco revenue and orders report
query {
  metricReport(input: {
    timeRange: { relative: THIS_MONTH },
    dimensions: [
      { columnName: "restaurant_name" }, 
			{ columnName: "taco_name"}
    ],
    metrics: [
      { uniqueName: "Revenue" },
      { uniqueName: "Taco Sales Count" }
    ],
    orderByColumn: 1,
    first: 10
  }) {
    headers
    rows
    pageInfo {
      startCursor
      endCursor
      hasNextPage
      hasPreviousPage
    }
  }
}
Read the docs
# Top 5 tacos sold this month
query {
  topValues(input: {
    dataPool: { "name": "TacoSoft Demo Data" },
    columnName: "taco_name",
    timeRange: { relative: THIS_MONTH },
    maxValues: 5
  }) {
    values
  }
}
Read the docs
# Daily revenue for this month
query {
  timeSeries(input: {
    metric: { name: "Revenue"},
    granularity: DAY,
    timeRange: { relative: THIS_MONTH },
    filters: []
  }) {
    labels
    values
  }
}
Read the docs
Visualize

Embed pixel-perfect dashboards in minutes

Simply add the <TimeSeries/>, <Counter/>, <Leaderboard/>, or <SimpleFilter/> React components for your dashboard functionality. Match it to your brand with any CSS library, then deploy it as part of your app — no more janky-looking embedded iframes!

Propel Embeddable Dashboards
UI components
Deployment

Deploy Your Way

No matter how you choose to deploy we have you covered

Connect your own ClickHouse

Clickhouse Diagram
  • Works with self-hosted ClickHouse.
  • Works with ClickHouse Cloud.
  • Full control of your ClickHouse deployment.
  • Data stays in your infrastructure.
  • Data is encrypted in transit.
  • Only pay for data passthrough.
  • All the Propel APIs and UI components.

Fully managed serverless cloud

Serverless diagram
  • Ingest data from any data source.
  • No infrastructure to manage or scale.
  • Serverless auto-scaling.
  • Mission-critical availability.
  • Unlimited storage.
  • Data is encrypted at rest and in transit.
  • Only pay for the storage you use and queries you make.

Book a technical call

Connect directly with a Propel solutions architect to explore how Propel can support your team. Get a live product demo and learn how to maximize the benefits of Propel.

Customers

Trusted by CTOs 
that get Sh*t done

"I've had to own this in the past, and it's not cheap. With Propel, we launched our enterprise dashboards in a couple of sprints.”

Seth Carney

CTO

"My goal is to deliver meaningful business insights to our customers. Propel makes this an easy and scalable process."

Joe McCorkle

CTO

"Propel is the way to go. It enabled us to launch user-friendly yet robust analytics quickly and efficiently on a large scale.”

Kristie Howard

Director of Engineering
Enterprise-Grade Security

Secure & Compliant

Visit the Trust Center to view more details on Propel’s security and compliance.

View the Trust Center
GDPR Icon
GDPR compliant
SOC2 compliant Icon
SOC 2 Type 2 compliant
GCPA Icon
CCPA compliant
Social

Stay updated and connected

All the latest news an updates.
Funnel analysis in ClickHouse

Funnel analysis in ClickHouse

Understanding user journeys better.
Team Propel
The team at Propel
October 24, 2024

Twitter

Stay up to date with the latest news and more from the Propel team.

Product updates

Receive the latest product updates and resources to build with ClickHouse.
Start shipping today

Deliver the analytics your customers have been asking for.