Introduction
In this post, you’ll learn how to denormalize data in Snowflake into a dynamic table so you can build a customer-facing analytics dashboard with it using Propel.
What are Snowflake Dynamic Tables?
Snowflake Dynamic Tables are the building blocks of declarative data transformation pipelines in Snowflake. They simplify data engineering by allowing users to define the end state of a transformation using SQL, leaving the complex pipeline management to Snowflake. For an in-depth understanding, check out Snowflake's official documentation.
What does it mean to denormalize my data?
Denormalizing data means taking data that is stored in a normalized form, with multiple tables that are related to each other, and combining them into fewer, larger tables.
Why should I denormalize my data?
Denormalizing can make querying the data faster and more efficient for analytical purposes, as there are fewer joins needed to retrieve the desired information.
Example

Imagine a scenario where you're tracking taco sales across various restaurants. In a normalized database:
- The ORDER_ITEM table holds individual taco orders, with columns like toppings as arrays, but references to the type of taco or the sauce used are stored as foreign IDs.
- The TACO_ORDER table provides details about each order, including which restaurant it came from, using a foreign ID for the restaurant.
- Separate tables like RESTAURANT, TACO, and TORTILLA hold specific details about restaurants, taco types, and tortilla types, respectively.
Now, if you wanted to know the details of a specific taco order from the ORDER_ITEM table, like which restaurant it came from or the type of taco, you'd need to perform multiple joins with the TACO_ORDER, RESTAURANT, and TACO tables.
Denormalizing this data would mean combining relevant columns from these tables into a single, larger table. This new table would have columns not just for toppings, but also for the restaurant name, taco type, and other details. With this structure, retrieving comprehensive order details would require no joins, making queries faster and more efficient.
Creating a dynamic table that denormalizes your tables
Building on our taco sales example, let's craft a query to create a denormalized dynamic table:
Query breakdown:
- Dynamic table creation: Using CREATE OR REPLACE DYNAMIC TABLE, we're creating a new dynamic table. If a table with the same name already exists, it will be replaced.
- Target lag & warehouse: TARGET_LAG is set to '1 DAY', ensuring our data is updated to reflect changes within a day. The computing resources are specified with WAREHOUSE = TRANSFORMING.
- Data selection & join operations: The SELECT statement fetches columns like order timestamps, restaurant names, and taco details. Using LEFT JOIN, we combine data from our base tables based on their relationships.
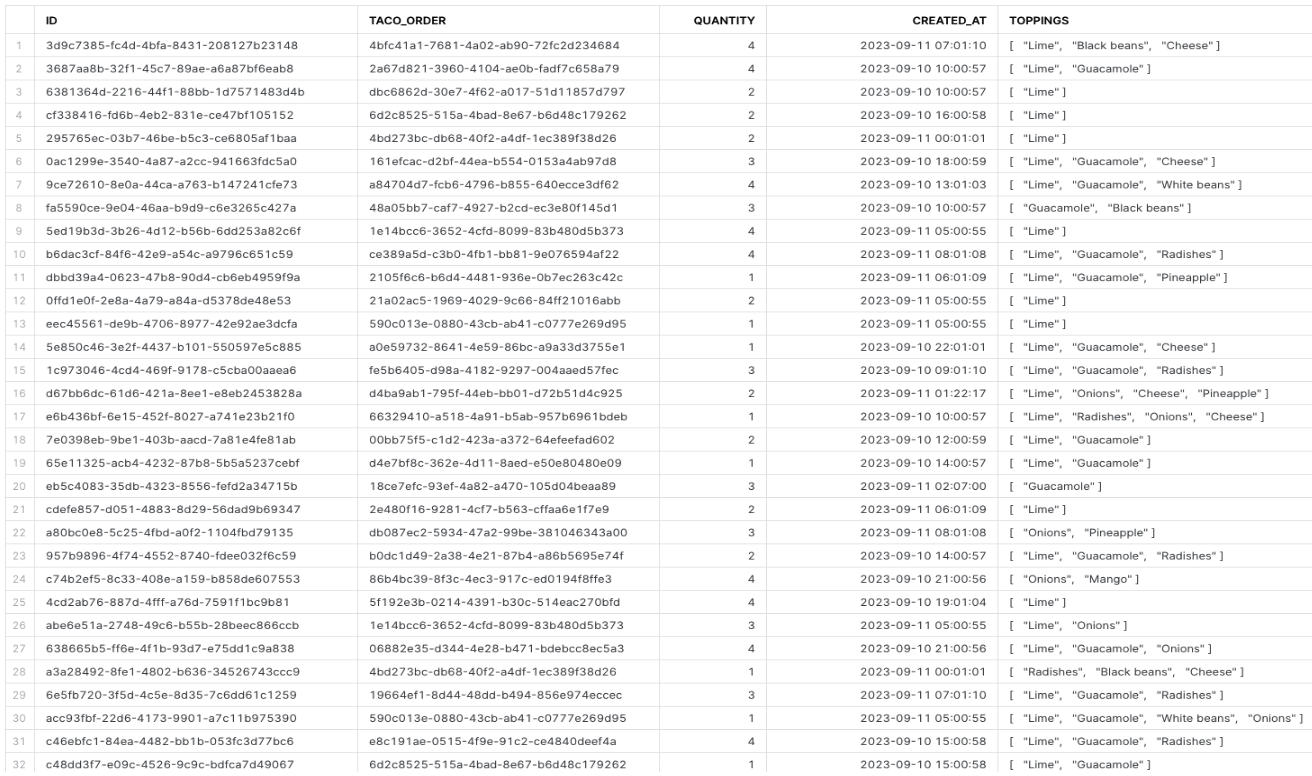
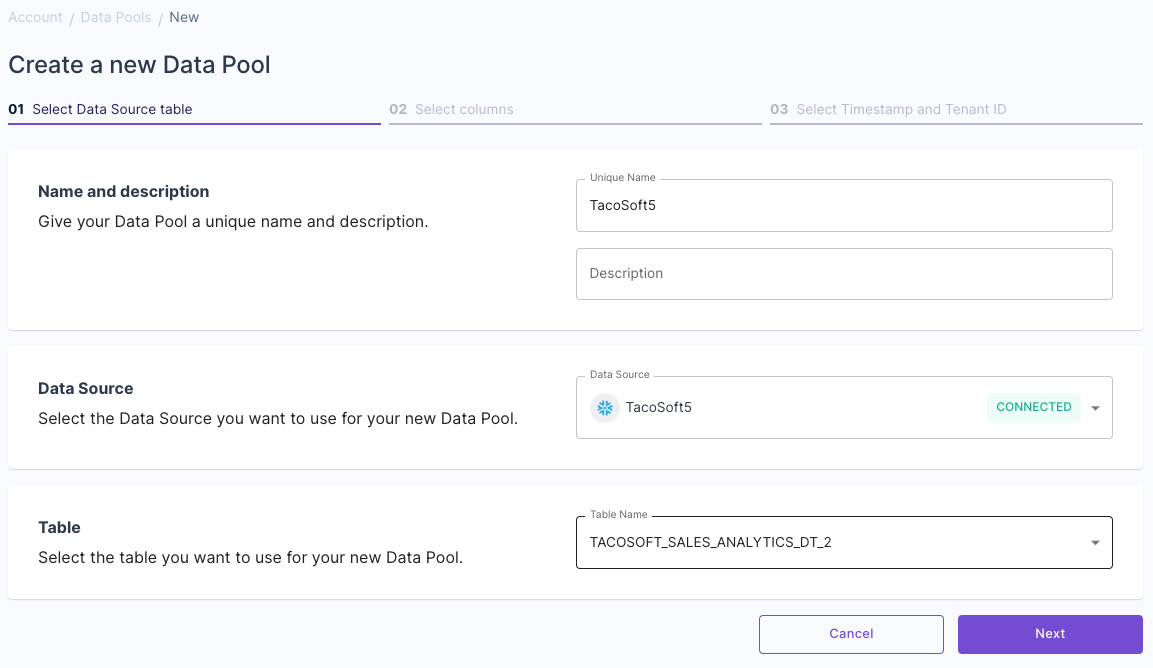
Once you execute this query in Snowflake, you'll have a dynamic table named TACOSOFT_SALES_ANALYTICS_DT_2 that consolidates your taco sales data.
Note on CHANGE_TRACKING: For dynamic tables to update correctly, CHANGE_TRACKING must be enabled on all underlying tables. While Snowflake attempts to set this up during creation, ensure you have the right privileges to avoid any issues.
Once the query to create your dynamic table successfully runs, you can verify that it’s been created by showing all dynamic tables:
You can inspect the content of the newly created dynamic table with:
You may see that it’s still empty. This may be because the data hasn’t been refreshed yet.
In that case, you can run a manual refresh with:
Creating a customer-facing dashboard based on this table
Now that you’ve denormalized your data into a Snowflake dynamic table, you can use this table to create a customer-facing dashboard using Propel.
To do this, first, create a Propel Data Source from the database and schema containing your newly created dynamic table following our guide on how to set up a Snowflake Data Source.
Then, create a Data Pool using the Data Source you just created, selecting your dynamic table.

Then, you can start visualizing your data using Propel’s APIs to power your dashboard. You can explore and iterate on the visualizations you need in the Metric Playground, and you will see the GraphQL API request to power your dashboard.

To learn how to start creating your own customer-facing analytics dashboard in this manner, feel free to check out our Quickstart.


